First fact:
Oracle RDBMS use its own memory manager. There're a lot of functions on several layers which do allocation and deallocation of memory chunks. And as I wrote once upon a time, almost each among of these functions beside block size also takes small human-readable commentary about what this memory allocated for and where. Often, this commentary consisted of two strings: function name who allocate block and data structure name. For example "kksol : kkscuf". Surprisingly, I never seen any other product where this method is used, except of Windows NT kernel. Bonuses of this method are: 1) it is extremely simple to see a statistics, who allocated a lot of blocks and what they hold? 2) Memory leaks detection. Just before shutdown, look on open blocks list and see, what function forgot to deallocate block.
Second fact:
Oracle RDBMS is rich of manifold data structures. In fact, I could even call this "object-oriented" programming, but not in the sense of programming language like C++, but in essence, just like Windows NT architecture (Oracle kernel and Windows NT both written in C language).
While trying to understand some piece of code like:
if (*(*(*(arg_0+0x123)+0xABC)+0x678)==constant) do_something()
... we can see here that arg_0 is actually pointer to some structure which holds another structure inside of it which is, in turn, hold another. It is thrice nested structure.
I can use my generic tracer tool to check arguments state of calling function, but dumping just address of structures is useless. I can dump some data to which each argument is pointing, but this is useless too.
But I remember about Oracle memory manager. What I can do is to intercept all memory allocation and memory deallocation functions calls. At this step, my tracer will be able to hold a table what is allocated, addresses of each block, its size and human-readable comment.
At this point, when some function called and its argument is pointer to known allocated block in memory, my tool is able to print human-readable comment. Not very practical, but better than just raw address value.
What my tool is also can do is to scan each block for pointers to another known memory blocks.
Algorithm is simple: 1) collect information about memory allocations and clear each block after allocation: we need this to get rid of mess induced by previous memory allocations; 2) when function of interest is called, check, if its arguments are pointers to known memory blocks; 3) scan each memory block in limits of its size (we know blocks' sizes too!); 4) if at some offset there are pointer to another memory block - add it to our queue and process it too; 5) create report...
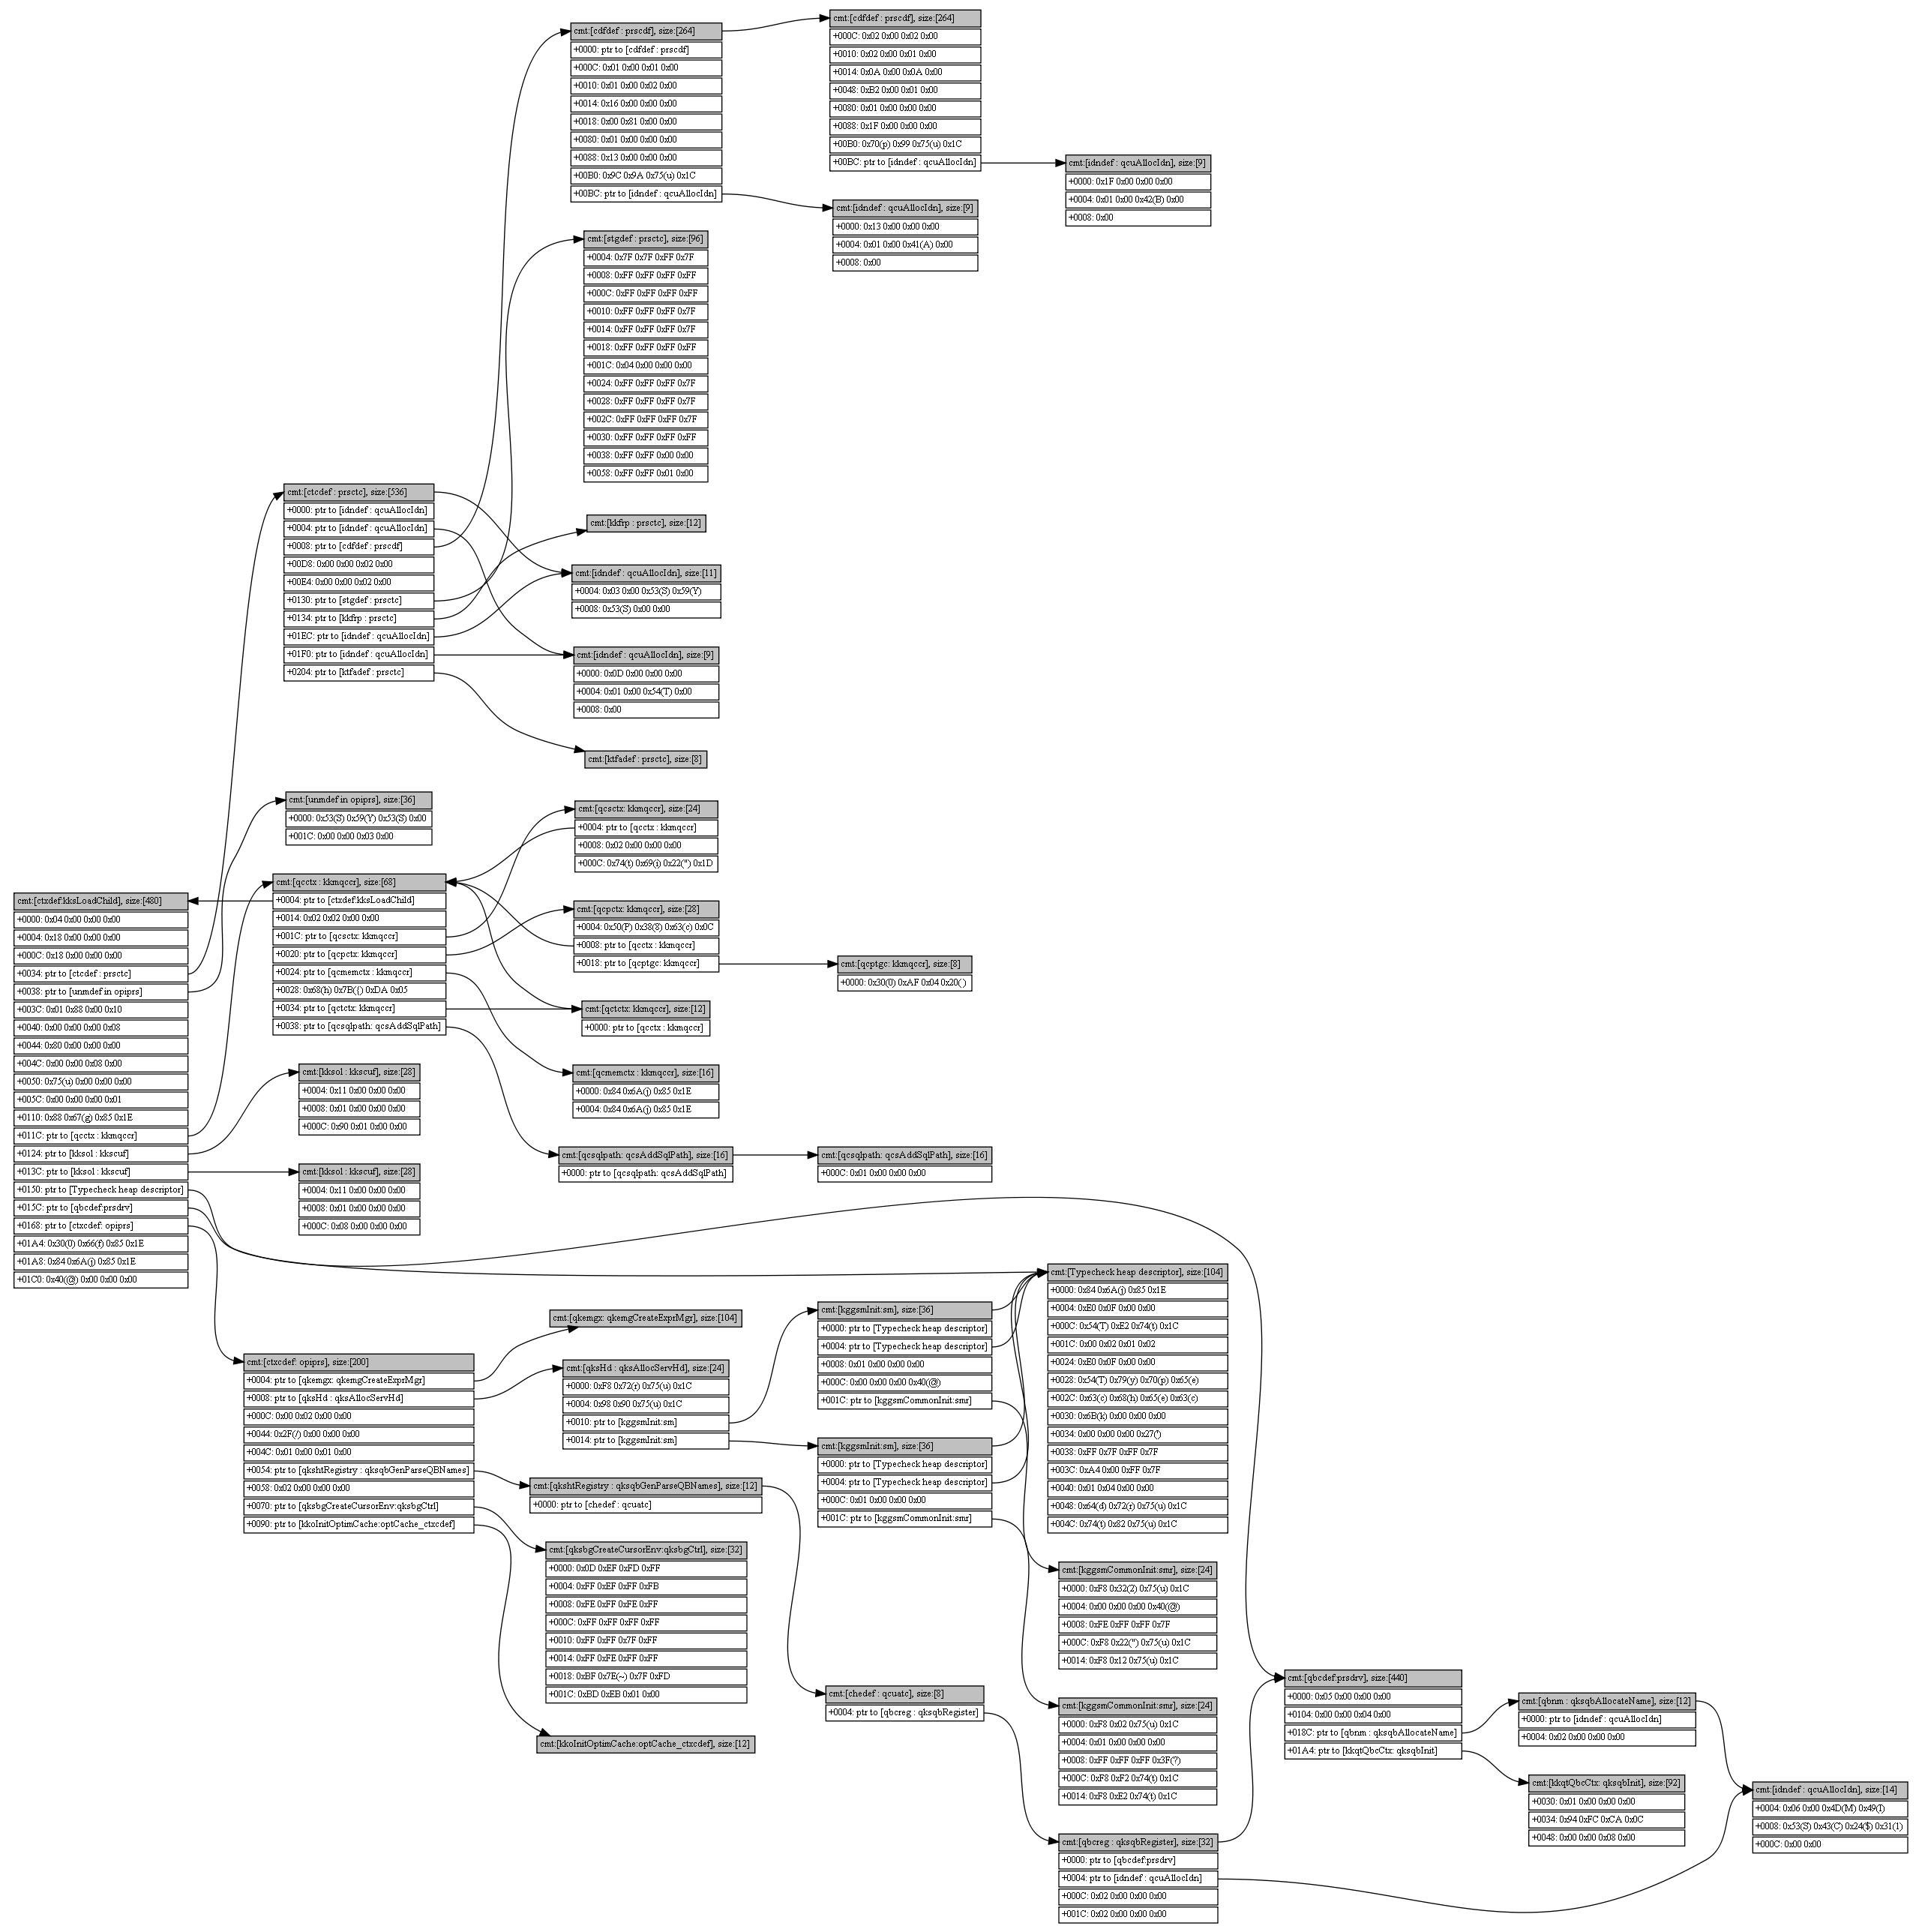
There're a lot of information, many Oracle functions use very complex data structures. I choose GraphViz to render this information.
Here is an example. A function ctcpre1() is used while the process of handling statements like "CREATE TABLE". But not the only this function. We know that it has only one argument.
I run my tool attached to Oracle process. I type "CREATE TABLE something" in sqlplus and ctcpre1() function was called. Here is graph rendered in GraphViz.
(click on picture to see large version)
The only argument of ctcpre1() function was a pointer to a block called "ctxdef:kksLoadChild": it is on the left side. Its name meaning that its data type is "ctxdef" and it was allocated in kksLoadChild() function.
At offset +34 of this block there are a pointer to another block called "ctcdef:prsctc". This block was created in prsctc() function. prs* functions probably related to parsing procedures.
Et cetera. Something is visible, something is not. If block is rendered as empty, it was filled only by zeroes. Holes of zeroes are skipped too. This information is complex too, but it can give us a lot!
The utility which is able to produce such information is modified generic tracer, but it is not very stable to publish it yet.
I can use this method not only with Oracle, but with any other software code: I'll not have memory blocks human-readable comments, but it is anyway better than nothing

→ [list of blog posts] Please drop me email about bug(s) and/or suggestion(s): my emails.