gt is command-line utility for performing simple debugging tasks.
Major features:
Minor features:
-l:<fname.exe>: load process.
-c:<cmd_line>: define command line for loading process.
For example:
gt.exe -l:bzip2.exe -c:--help
Command line contain spaces:
gt.exe -l:rar.exe "-c:a archive.rar *"
-a<fname.exe|PID>: attach to running process by file name or PID number
Process with that filename should be already loaded. If there're several processes with the same name, gt will attach to all of them simultaneously.
--loading: dump all module filenames and base addresses while loading.
--child: attach to all child processes too.
For example, you could run gt.exe -l:cmd.exe, this will open cmd window and every process running inside command interpreter will be handled by gt.
--allsymbols[:<regexp>]: dump all symbols during load or by regular expression:
--allsymbols:somedll.dll!.* can be used for dumping all symbols in some DLL.
--allsymbols:.*printf will print something like this:
New symbol. Module=[ntdll.dll], address=[0x77C004BC], name=[_snprintf]
New symbol. Module=[ntdll.dll], address=[0x77B8E61F], name=[_snwprintf]
[...skipped...]
New symbol. Module=[msvcrt.dll], address=[0x75725F37], name=[vswprintf]
New symbol. Module=[msvcrt.dll], address=[0x75726649], name=[vwprintf]
New symbol. Module=[msvcrt.dll], address=[0x756C3D68], name=[wprintf]
-s: show call stack before each breakpoint.
Example:
gt.exe -l:hello.exe -s bpf=kernel32.dll!WriteFile,args:5
We will see:
23B4 (0) KERNEL32.dll!WriteFile (7, "hello to gt!\r\n", 0x0000000E, 0x0017E3A4, 0) (called from 0x7317754E (MSVCR90.dll!_lseeki64+0x56b))
Call stack of thread 0x23B4
return address=731778D8 (MSVCR90.dll!_write+0x9f)
return address=7313FB4A (MSVCR90.dll!_fdopen+0x1c0)
return address=7313F70C (MSVCR90.dll!_flsbuf+0x6e1)
return address=73141E50 (MSVCR90.dll!printf+0x84)
return address=0040100E (hello.exe!BASE+0x100e)
return address=0040116F (hello.exe!BASE+0x116f)
return address=76FCE4A5 (KERNEL32.dll!BaseThreadInitThunk+0xe)
return address=77C9CFED (ntdll.dll!RtlCreateUserProcess+0x8c)
return address=77C9D1FF (ntdll.dll!RtlCreateProcessParameters+0x4e)
23B4 (0) KERNEL32.dll!WriteFile -> 1
Stack dump can be very handy, for example, we have a program showing Message Box once and by intercepting USER32.DLL!MessageBoxA call we can see a path to this call.
Stack dump feature available for all BPF/BPX/BPM features.
Note: this feature do not work in x64 version yet.
-t: write timestamp at each log line:
For example:
gt.exe -l:bzip2.exe bpf=kernel32.dll!writefile,args:4 -t
[2009-12-05 04:55:50:747] TID=6356|(0) KERNEL32.dll!WriteFile (0x1b, " --help'.p, type: `pressed data to a terminal.", 9, 0x286c54)
[2009-12-05 04:55:50:749] TID=6356|(0) KERNEL32.dll!WriteFile -> 1
--help: print help.
-q: be quitet, no output.
@: option allows to store all options in a text file profile and use the latter:
gt.exe @filename
Each line in the profile represents an option. This can be handy for lengthy and/or often used options, like bytemasks (see below).
"@" option can be used along with any other options:
gt.exe -l:filename.exe @additional_options @even_more_options
There're 3 ways to define breakpoint address.
1) By hexadecimal: 0x00400000.
2) By symbol.
For example:
kernel32.dll!writefile
Regular expressions can be used here. For example: .*!printf: gt will look for "printf" symbol in each loading module. If the same name occurs in different modules, gt will use only the first occurence.
It is Perl syntax.
Refer: Perl Regular Expression Syntax
Offset is allowed here. For example: file.exe!base+0x1234 (base is predefined symbol equals to PE file base) or file.exe!label+0xa
3) By bytemask.
Sometimes, we would like to define breakpoint inside of an executable by byte pattern, just like IDA signature.
For example:
gt -l:cycle.exe bpf=558BEC8B45085068........FF15........83C4085DC3,args:1
gt will look for this pattern in each executable section of each loading module and will print:
===============================================================================
cycle.exe: searching for bytemask_0 in .text section...
bytemask_0 is resolved to address 0x00401000 (cycle.exe)
===============================================================================
Two dots instead of two hexadecimal digits mean *any*byte*. This can be useful for skipping FIXUPs, etc.
It is also possible to mention [skip:n] to skip several bytes during bytemask search, for example: 55[skip:10]1100 - this is equivalent to bpf=55....................1100
Only bytes from the beginning of function are enough.
Note: bytestring can appear more than once in one module. gt will warn us on, and use only the first occurence by default. This means that function byte pattern is to be constructed carefully.
BPF=<address>,<BPF_options>
BPF option, in a way, it is a kind strace utility.
Significant differences with strace are:
BPF with address but without BPF_options will only track the moment when function was called and what it returns.
For example:
gt.exe -l:bzip2.exe bpf=kernel32.dll!WriteFile
1188 (0) KERNEL32.dll!WriteFile () (called from 0x610AC912 (cygwin1.dll!sigemptyset+0x1022))
1188 (0) KERNEL32.dll!WriteFile -> 1
Note: gt doesn't know some function is void type, e.g., it doesn't return any value. So it just takes the value at EAX/RAX register.
BPF_options:
ARGS:<number>: define arguments number for the function we would like to intercept.
For example:
gt.exe -l:bzip2.exe -c:--help bpf=kernel32.dll!WriteFile,args:5
09D0 (0) KERNEL32.dll!WriteFile (0x0000001B, "   If no file names are given, bzip2 compresses or decompresses", 0x0000003F, "?", 0)
09D0 (0) KERNEL32.dll!WriteFile -> 1
09D0 (0) KERNEL32.dll!WriteFile (0x0000001B, "   from standard input to standard output.  You can combinesses", 0x0000003B, ";", 0)
09D0 (0) KERNEL32.dll!WriteFile -> 1
09D0 (0) KERNEL32.dll!WriteFile (0x0000001B, "   short flags, so `-v -4' means the same as -v4 or -4v, &c.ses", 0x0000003C, "<", 0)
09D0 (0) KERNEL32.dll!WriteFile -> 1
What we see here is an attempt to read 5 arguments at each WriteFile function call.
If some of these arguments are pointers to some area within process memory, and the data at the pointer can be interpreted as ASCII string, it will be printed instead.
This is useful when intercepting string functions like strcmp(), strlen(), strtok(), atoi(), and so on.
It is not a problem to make mistake on arguments number (except using skip_stdcall option, see below). If defined arguments number greater than real, captured local variables of caller function probably will be printed. Or any other useless junk. If defined arguments number is less than real, then only part of arguments will be visible.
RT:<number>: replace the returning value of any function by something else, on fly.
gt -l:filename.exe bpf=function,args:1,rt:0x12345678
gt will put this value to EAX/RAX right at the moment when function exited.
SKIP: bypass a function. This can be used with RT option too.
gt -l:filename.exe bpf=function,args:1,rt:0x12345678,skip
This means that the function just gets bypassed and its return value is fixed at 0x12345678.
Note: without "0x" prefix, this value would be interpreted as decimal number.
SKIP_STDCALL: the same as SKIP option but rather used for stdcall functions.
The difference between cdecl and stdcall calling conventions is just that cdecl function doesn't align stack pointer at exit (caller should do this). stdcall function aligns stack pointer at exit. cdecl is the most used calling convention. However, stdcall is used in MS Windows. So, if you would like to skip a function in KERNEL32.DLL or USER32.DLL, you should use skip_stdcall. Consequently, in this case, gt must know the exact arguments number, without it the process may crash.
Refer: X86 calling conventions
If you'd like to suppress all WriteFile calls, do this:
gt.exe -l:hello.exe bpf=kernel32.dll!WriteFile,args:5,skip_stdcall,rt:1
Don't forget to make it return 1, so the caller will not suspect anything!
WriteFile arguments number is just 5. Change it to something different, and process crashes.
Note: stdcall calling convention is absent in Windows x64, so this option is disabled in gt64.
UNICODE: treat strings in arguments as unicode (widechar). This could be helpful if you intercept unicode win32 functions with W suffix, for example, MessageBoxW.
Unfortunately, gt can only automatically detect first half of ASCII table, so multilingual unicode strings will not be detected.
DUMP_ARGS:<size>: dump memory on argument (if readable) limited by max size
If argument contain pointer to valid memory block, it will be printed.
At the function exit, if memory block contents was changed, difference will be printed too.
For example:
gt64.exe -l:test_getlocaltime.exe bpf=.*!getlocaltime,args:1,dump_args:0x30
TID=6660|(0) KERNEL32.dll!GetLocalTime (0x12ff00) (called from 0x14000100f (getlocaltime.exe!BASE+0x100f))
Dump of buffer at argument 1 (starting at 1)
000000000012FF00: 28 FF 12 00 00 00 00 00-00 00 00 00 00 00 00 00 "(..............."
000000000012FF10: 01 00 00 00 00 00 00 00-73 11 00 40 01 00 00 00 "........s..@...."
000000000012FF20: 00 00 00 00 00 00 00 00-00 00 00 00 00 00 00 00 "................"
TID=6660|(0) KERNEL32.dll!GetLocalTime -> 0x150
Dump difference of buffer at argument 1 (starting at 1)
0000000000000000: D9 07 0C    06    05   -05    10    24    50 01 "... . . . . $ P."
Now we can see how GetLocalTime win32 function fill SYSTEMTIME structure.
gt -l:bzip2.exe bpf=.*!fprintf,args:3
TID=5128|(0) cygwin1.dll!fprintf (0x61103150, "%s: I won't write compressed data to a terminal.\n", "bzip2") (called from 0x401e03 (bzip2.exe!BASE+0x1e03))
TID=5128|(0) cygwin1.dll!fprintf -> 0x34
TID=5128|(0) cygwin1.dll!fprintf (0x61103150, "%s: For help, type: `%s --help'.\n", "bzip2") (called from 0x401c66 (bzip2.exe!BASE+0x1c66))
TID=5128|(0) cygwin1.dll!fprintf -> 0x27
gt.exe -l:someprocess.exe bpf=advapi32.dll!RegOpenKeyExA,args:5 bpf=advapi32.dll!RegQueryValueExA,args:6 bpf=advapi32.dll!RegSetValueExA,args:6
.. or change function suffixes to W and add UNICODE option
gt64.exe -l:far.exe bpf=advapi32.dll!RegOpenKeyExW,args:5,unicode bpf=advapi32.dll!RegQueryValueExW,args:6,unicode bpf=advapi32.dll!RegSetValueExW,args:6,unicode
gt.exe -l:beeper.exe bpf=kernel32.dll!Beep,args:2,skip_stdcall,rt:1
gt.exe -l:filename.exe bpf=user32.dll!MessageBoxA,args:4,skip_stdcall,rt:1
Another fun is intercepting rand() function in various games. For example, Windows Solitaire card game use it to generate random deal. We can fix rand() return at zero, and Solitaire will do the same deal each time, forever:
In Windows XP x86/x64:
gt.exe/gt64.exe -l:c:\windows\system32\sol.exe bpf=.*!rand,rt:0
In Windows 7 x64:
gt64.exe -l:[full path to]\Solitaire.exe bpf=.*!rand,rt:0
When you run Windows (XP SP3) FreeCell and press F2 (New game), you will get a message box "Do you want to resign this game?" We can suppress all that beeping and also make illusion to FreeCell user always press YES:
IDYES constant is 6. FreeCell use MessageBoxW - W mean unicode version of MessageBox.
In Windows XP SP3 x86:
gt.exe -l:c:\windows\system32\freecell.exe bpf=user32.dll!messagebeep,args:1,skip_stdcall bpf=user32.dll!messageboxw,args:4,unicode,skip_stdcall,rt:6
TID=444|(0) USER32.dll!MessageBeep (0x20) (called from 0x1001f52 (freecell.exe!BASE+0x1f52))
We skip execution of this function
TID=444|(1) USER32.dll!MessageBoxW (0x80122, L"Do you want to resign this game?", L"FreeCell", 0x24) (called from 0x1001f5f (freecell.exe!BASE+0x1f5f))
We skip execution of this function
TID=444|We modify return value (EAX) of this function to 6
In Windows XP SP2 x64 Russian:
gt64.exe -l:c:\windows\system32\freecell.exe bpf=user32.dll!messagebeep,args:1,skip bpf=user32.dll!messageboxw,args:4,unicode,skip,rt:6
TID=2028|(0) USER32.dll!MessageBeep (0x20) (called from 0x1000023f9 (freecell.exe!BASE+0x23f9))
We skip execution of this function
TID=2028|(1) USER32.dll!MessageBoxW (0x1f00f0, 0xbf80, 0xbf20, 0x24) (called from 0x100002416 (freecell.exe!BASE+0x2416))
We skip execution of this function
TID=2028|We modify return value (RAX) of this function to 6
In Oracle 10.2.0.1 win64:
gt64.exe -a:oracle.exe bpf=oracle.exe!ksdpec,args:1 bpf=oracle.exe!ss_wrtf,args:3
( see also: http://blogs.conus.info/node/14 )
TID=3032|(0) oracle.exe!ksdpec (0x2743) (called from 0x9580a9 (oracle.exe!opiodr+0x105))
TID=3032|(0) oracle.exe!ksdpec -> 0xff
TID=3032|(1) oracle.exe!ss_wrtf (0x4a0, "*** 2009-12-04 06:19:01.005\n", 0x1b) (called from 0x45318d (oracle.exe!sdpri+0x22d))
TID=3032|(1) oracle.exe!ss_wrtf -> 1
TID=3032|(1) oracle.exe!ss_wrtf (0x4a0, "OPI CALL: type=107 argc= 3 cursor=  0 name=SES OPS (80)\n", 0x37) (called from 0x45318d (oracle.exe!sdpri+0x22d))
TID=3032|(1) oracle.exe!ss_wrtf -> 1
TID=3032|(0) oracle.exe!ksdpec (0x2743) (called from 0x9580a9 (oracle.exe!opiodr+0x105))
TID=3032|(0) oracle.exe!ksdpec -> 0xff
TID=3032|(1) oracle.exe!ss_wrtf (0x4a0, "OPI CALL: type=59 argc= 4 cursor=  0 name=VERSION2\n", 0x32) (called from 0x45318d (oracle.exe!sdpri+0x22d))
TID=3032|(1) oracle.exe!ss_wrtf -> 1
TID=3032|(0) oracle.exe!ksdpec (0x273e) (called from 0x4a00cc (oracle.exe!kslwte_tm+0x7a8))
TID=3032|(0) oracle.exe!ksdpec -> 0
TID=3032|(0) oracle.exe!ksdpec (0x273e) (called from 0x4a00cc (oracle.exe!kslwte_tm+0x7a8))
TID=3032|(0) oracle.exe!ksdpec -> 0
TID=3032|(0) oracle.exe!ksdpec (0x2743) (called from 0x9580a9 (oracle.exe!opiodr+0x105))
TID=3032|(0) oracle.exe!ksdpec -> 0xff
TID=3032|(1) oracle.exe!ss_wrtf (0x4a0, "OPI CALL: type=104 argc=12 cursor=  0 name=Transaction Commit/Rollback\n", 0x46) (called from 0x45318d (oracle.exe!sdpri+0x22d))
TID=3032|(1) oracle.exe!ss_wrtf -> 1
gt.exe/gt64.exe -a:oracle.exe bpf=.*!kghalf,args:6 bpf=.*!kghfrf,args:4
TID=1600|(0) oracle.exe!kghalf (0x6d35af0, 0xb507ef8, 0x1000, 0, 0, "kzsrcrdi") (called from 0x1c7aa83 (oracle.exe!kzctxhugi+0x71))
TID=1600|(0) oracle.exe!kghalf -> 0xfa3ea58

TID=1600|(0) oracle.exe!kghalf (0x6d35af0, 0xb507ef8, 0x58, 1, 0x6d35530, "UPI heap") (called from 0x1e7f8b7 (oracle.exe!__PGOSF266_kwqmahal+0x5b))
TID=1600|(0) oracle.exe!kghalf -> 0xfa4d0d8

TID=1188|(0) oracle.exe!kghalf (0xda39540, 0xda39240, 0x88, 0, "ksirmdt array", 0xda39240) (called from 0x6afb5b (oracle.exe!ksz_nfy_ipga+0xf1))
TID=1188|(0) oracle.exe!kghalf -> 0x105d0b10

TID=1188|(0) oracle.exe!kghalf (0xda39540, 0xda39240, 0x48, 1, 0x1204e400, "local") (called from 0x3684a64 (oracle.exe!kjztcxini+0x58))
TID=1188|(0) oracle.exe!kghalf -> 0x105d0ab0
In Oracle 11.1.0.6.0 win32/win64:
gt.exe/gt64.exe -a:oracle.exe bpf=oracle.exe!_?rpisplu,args:8 bpf=oracle.exe!_?kprbprs,args:7 bpf=oracle.exe!_?opiprs,args:6 bpf=oraclient11.dll!OCIStmtPrepare,args:6
Note: regular expression _?function cover both function and _function
TID=1140|(2) oracle.exe!opiprs (0x13f029d0, "select 1 from obj$ where name='DBA_QUEUE_SCHEDULES'", 0x34, 0x10ae7f50, 0x840082, 0xd9f7a10) (called from 0x6ba3bf (oracle.exe!__PGOSF423_kksParseChildCursor+0x2dd))
TID=1140|(2) oracle.exe!opiprs -> 0
TID=1140|(2) oracle.exe!opiprs (0x13f029d0, "select 1 from sys.aq$_subscriber_table where rownum < 2 and subscriber_id %lt;%gt; 0 and table_objno %lt;%gt; 0", 0x64, 0x10ad5de8, 0, 0x13f007e0) (called from 0x6ba3bf (oracle.exe!__PGOSF423_kksParseChildCursor+0x2dd))
TID=1140|(2) oracle.exe!opiprs -> 0
TID=1140|(0) oracle.exe!rpisplu (3, 0, 0, 0, 0, 0x14430ac0, 0, 0) (called from 0x250b33c (oracle.exe!kqdGetCursor+0x106))
TID=1140|(0) oracle.exe!rpisplu -> 0
TID=1288|(2) oracle.exe!opiprs (0x17df8130, "select * from v$version", 0x18, 0x10adee60, 0, 0) (called from 0x6ba3bf (oracle.exe!__PGOSF423_kksParseChildCursor+0x2dd))
TID=1288|(1) oracle.exe!kprbprs (0xa82bc50, 0, "select timestamp, flags from fixed_obj$ where obj#=:1", 0x35, 0xffffe3e0, 0x2040800, 1) (called from 0x2ba1b1f (oracle.exe!kqldtstr+0x151))
TID=1288|(1) oracle.exe!kprbprs -> 0
TID=1288|(0) oracle.exe!rpisplu (0x1f, 0, 0, 0, 0, 0x2bb5e04, "select  BANNER from GV$VERSION where inst_id = USERENV('Instance')", 0xffffc085) (called from 0x2bbcabf (oracle.exe!kqldFixedTableLoadCols+0x157))
TID=1288|(1) oracle.exe!kprbprs (0x1090c108, 0, "select timestamp, flags from fixed_obj$ where obj#=:1", 0x35, 0xffffe3e0, 0x2040800, 1) (called from 0x2ba1b1f (oracle.exe!kqldtstr+0x151))
TID=1288|(1) oracle.exe!kprbprs -> 0
TID=1288|(1) oracle.exe!kprbprs (0x10908060, 0, "select timestamp, flags from fixed_obj$ where obj#=:1", 0x35, 0xffffe3e0, 0x2040800, 1) (called from 0x2ba1b1f (oracle.exe!kqldtstr+0x151))
TID=1288|(1) oracle.exe!kprbprs -> 0
TID=1288|(2) oracle.exe!opiprs -> 0
TID=1288|(0) oracle.exe!rpisplu -> 0
TID=1288|(0) oracle.exe!rpisplu (0x16, 0, 0, 0, 0, 0x10b3ce50, 0, 0) (called from 0x250b33c (oracle.exe!kqdGetCursor+0x106))
TID=1288|(0) oracle.exe!rpisplu -> 0
gt -l:target.exe bpf=Wintrust.dll!WinVerifyTrust,rt:0
gt.exe -l:rar.exe "-c:a archive.rar *.exe" bpf=kernel32.dll!writefile,args:5,dump_args:0x10
RAR writting its signature to archive.rar file:
TID=7000|(0) KERNEL32.dll!WriteFile (0x118, 0x152410, 7, 0x150fc0, 0) (called from 0x403721 (rar.exe!__GetExceptDLLinfo+0x26c8))
Dump of buffer at argument 2 (starting at 1)
00152410: 52 61 72 21 1A 07 00 00-50 30 15 00 5D 83 40 00 "Rar!....P0..].@."
Dump of buffer at argument 4 (starting at 1)
00150FC0: 00 00 00 00 21 7B 40 00-10 24 15 00 18 24 15 00 "....!{@..$...$.."
TID=7000|(0) KERNEL32.dll!WriteFile -> 1
gt.exe -l:rar.exe "-c:x archive.rar" bpf=kernel32.dll!readfile,args:4,dump_args:0x10
RAR archiver open archive.rar and read signature:
TID=6148|(0) KERNEL32.dll!ReadFile (0x120, 0x17b3f8, 7, 0x174c50) (called from 0x403966 (rar.exe!__GetExceptDLLinfo+0x290d))
Dump of buffer at argument 2 (starting at 1)
0017B3F8: 00 00 00 00 00 00 00 00-00 00 00 00 48 00 00 00 "............H..."
Dump of buffer at argument 4 (starting at 1)
00174C50: 07 00 00 00 78 4C 17 00-7A 38 40 00 8C 6D 17 00 "....xL..z8@..m.."
TID=6148|(0) KERNEL32.dll!ReadFile -> 1
Dump difference of buffer at argument 2 (starting at 1)
00000000: 52 61 72 21 1A 07      -                        "Rar!..          "
Content of all CPU registers will be printed.
If at least one FPU register contain something, it will be printed too.
If the floating point number is also NaN (Not-a-Number), FPU register contents will be treated as MMX register and will be dumped too.
If -fpu_always option is set, FPU registers state will be dumped at each breakpoint.
If -fpu_never option is set, FPU registers state will not be dumped.
If -dump_xmm option is set, each XMM registers state will be dumped too, unless it is empty.
DUMP(ADDRESS|REGISTER[+OFFSET],SIZE): dump contents of memory. Define memory address by hexadecimal address or in form REGISTER+OFFSET. SIZE is memory dump size.
SET (REGISTER,VALUE): set register to value. EIP/RIP, FPU registers ST0..ST7 and flags (PF, SF, AF, ZF, OF, CF, DF) are allowed. Value will be treated as decimal or floating point, unless prefix 0x is present.
Note: gt never modify FPU tag word register as well as not modify TOP register, so, if some FPU register was marked as "empty" and gt set some value there, it will remain marked "empty".
Changing EIP/RIP is on other words is code flow altering. This is useful to bypass some code pieces.
In Windows XP SP2 x64 Russian:
gt64.exe -l:c:\windows\system32\taskmgr.exe bpx=0x000000010000A8E4,set(rax,64)
In Windows XP SP3 x86 English:
gt.exe -l:c:\windows\system32\taskmgr.exe bpx=0x01006647,set(eax,32)
Let's imagine we have a code we compile in MS VC 2008:
printf ("%d\n", strcmp("one", "two"));
After compiling we got:
.text:00401000 BA 50 A1 40 00                    mov     edx, offset aTwo ; "two"
.text:00401005 B9 54 A1 40 00                    mov     ecx, offset aOne ; "one"
.text:0040100A 8D 9B 00 00 00 00                 lea     ebx, [ebx+0]
.text:00401010
.text:00401010                   loc_401010:                             ; CODE XREF: _main+2A
.text:00401010 8A 01                             mov     al, [ecx]
.text:00401012 3A 02                             cmp     al, [edx]
.text:00401014 75 29                             jnz     short loc_40103F
.text:00401016 84 C0                             test    al, al
.text:00401018 74 12                             jz      short loc_40102C
.text:0040101A 8A 41 01                          mov     al, [ecx+1]
.text:0040101D 3A 42 01                          cmp     al, [edx+1]
.text:00401020 75 1D                             jnz     short loc_40103F
.text:00401022 83 C1 02                          add     ecx, 2
.text:00401025 83 C2 02                          add     edx, 2
.text:00401028 84 C0                             test    al, al
.text:0040102A 75 E4                             jnz     short loc_401010
.text:0040102C
.text:0040102C                   loc_40102C:                             ; CODE XREF: _main+18
.text:0040102C 33 C0                             xor     eax, eax
.text:0040102E 50                                push    eax
.text:0040102F 68 58 A1 40 00                    push    offset byte_40A158 ; char *
.text:00401034 E8 1C 00 00 00                    call    _printf
.text:00401039 83 C4 08                          add     esp, 8
.text:0040103C 33 C0                             xor     eax, eax
.text:0040103E C3                                retn
Let's intercept inlined strcmp function and dump what is at ECX and EDX:
gt.exe -l:strcmp.exe bpx=8A013A02752984C074128A41013A4201751D83C10283C20284C075E433C0,dump(ecx,0x10),dump(edx,0x10)
We got:
bytemask_0 is resolved to address 0x401010 (strcmp.exe)
TID=6436|(0) 0x401010 (strcmp.exe!BASE+0x1010)
EAX=0x007722E0 EBX=0x7EFDE000 ECX=0x0040A154 EDX=0x0040A150
ESI=0x00000000 EDI=0x00000000 EBP=0x0018FF88 ESP=0x0018FF44
EIP=0x00401010
FLAGS=PF ZF IF
Dumping memory at ECX
0040A154: 6F 6E 65 00 25 64 0A 00-28 00 6E 00 75 00 6C 00 "one.%d..(.n.u.l."
Dumping memory at EDX
0040A150: 74 77 6F 00 6F 6E 65 00-25 64 0A 00 28 00 6E 00 "two.one.%d..(.n."
Note: only first bytemask occurence will be intercepted.
gt64.exe -l:flags.exe bpx=0x140001014,set(zf,1)
Note: the moment when gt can change registers state is the moment *before* current instruction is executed. Changing flags *before* TEST or CMP instructions is useless.
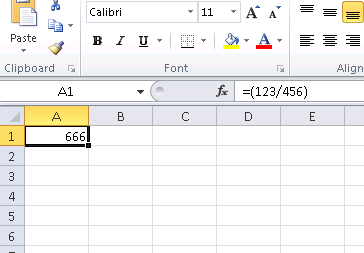
Make result of all divisions 666. Enter "=(123/456)" to check.
Works for Excel.exe version 14.0.4756.1000 (Microsoft Office 2010)
gt -l:excel.exe bpx=excel.exe!base+0x11E91B,set(st0,666)
gt64.exe -l:excel.exe bpx=excel.exe!base+0x1B7FCC,set(st0,666)
(The address there is the point after FDIV instruction actually do division here)
x86 architecture allows to set breakpoints on a memory value access.
That is, if someone or something modifies some value, gt will be instantly notified.
It is also should be noted that these breakpoints only practical for global variables, not local ones (stored in stack).
BPMB=<address>,<option>: set breakpoint on byte value access.
BPMW=<address>,<option>: set breakpoint on word value access.
BPMD=<address>,<option>: set breakpoint on dword value access.
BPMQ=<address>,<option>: set breakpoint on qword value access (available only in gt64)
W: set breakpoint only on memory value write.
RW: set breakpoint on both memory value read/write.
Note: because of some reason unknown to me, Intel achitecture offers only these two opportunities.
Let's trace read-write access to ktsmgd variable and see call stack:
gt.exe -a:oracle.exe -s bpmd=oracle.exe!_?ktsmgd_,rw
Run in SQL*Plus console (login as SYS):
ALTER SYSTEM SET "_disable_txn_alert"=1;
We got:
TID=2852|(0) oracle.exe!_ktsmgdcb+0x18: some code reading or writting DWORD variable at oracle.exe!_ktsmgd_ (now it contain 0x1)
Call stack of thread TID=2852
return address=0x4682f0 (oracle.exe!_kspptval+0x704)
return address=0x4674b0 (oracle.exe!_kspset0+0x928)
return address=0x8f23c6 (oracle.exe!_kkyasy+0x3cda)
return address=0x92ba1d (oracle.exe!_kksExecuteCommand+0x475)
return address=0x1f75e02 (oracle.exe!_opiexe+0x4bda)
return address=0x1e98390 (oracle.exe!_kpoal8+0x900)
return address=0x9df597 (oracle.exe!_opiodr+0x4cb)
return address=0x6102eb00 (oracommon11.dll!_ttcpip+0xab0)
return address=0x9de77e (oracle.exe!_opitsk+0x4fe)
return address=0x1fdf128 (oracle.exe!_opiino+0x430)
return address=0x9df597 (oracle.exe!_opiodr+0x4cb)
return address=0x450b1c (oracle.exe!_opidrv+0x32c)
return address=0x451352 (oracle.exe!_sou2o+0x32)
return address=0x401197 (oracle.exe!_opimai_real+0x87)
return address=0x401061 (oracle.exe!_opimai+0x61)
return address=0x401c55 (oracle.exe!_OracleThreadStart@4+0x301)
return address=0x77e66063 (KERNEL32.dll!GetModuleFileNameA+0xeb)
Visit http://blogs.conus.info/node/3 for more information about _disable_txn_alert parameter and ktsmgd value.
1) Press ESC or Ctrl-C to detach from the running process.
2) Press SPACE to see current call stacks for each thread.
For example: attach to some running application with opened Message Box, press SPACE and see what caused it.
Note: dump call stack feature absent in gt64.
gt use DebugActiveProcessStop() function to detach from the running process.
It is present in all modern NT-based operation systems, probably, except Windows NT and Windows 2000.
So all gt can do is just to kill the running process - sorry!
x86 architecture allow to use up to 4 breakpoints simultaneously. So, BPF/BPX/BPM features can be combined in any order 4 times.
Stack dumping feature consider stack frames "divided" with EBP base pointer:
Refer: Functions and Stack Frames
This means that any function which doesnt use this scheme will be excluded from stack dump - unintentionally.
Note: this feature absent in gt64.
All information dumped to stdout is also written to gt.log file. This file is erased at each start.
While loading or attaching, gt will inspect all modules: main executable and all DLL files loaded after. It will fetch all present symbols, incuding export entries of DLL files. It will also look for FileName.MAP file and try to parse information from it. MAP file has the same format as that produced by IDA disassembler. gt will also look for FileName.SYM file and try to load symbols from it, treating those as Oracle RDBMS SYM file format: ORACLE_HOME environment value should be set for this. gt will also look for FileName.PDB file (compile your program in MSVC with /Zi option and get debug PDB file for it).
Note: .MAP file loading is absent in gt64 (so far).
If DLL contain only exports by ordinals, e.g., without names (MFC DLLs, for example), the name of ordinal will be generated in compliance with ordinal_<number> format, for example, ordinal_12.
This release is not tested properly yet.
So please be prepared for any possible crash.
I strongly advice to do all experimentation in virtual machine.
If you find an annoying bug, please drop me a line: dennis@conus.info
Please attach gt.log file and screenshot of the last gt output.
I'll also be thankful for any comments and suggestions related to gt tool.
If you feel your contribution to source code is worth enough, please send me your patch.
Need a reverse engineering service? Drop me a note.
-- Dennis Yurichev / <dennis@conus.info>